Potentially Preventable Readmissions Report (PPRs)
Syntellis Axiom Software licenses software from 3M for classifying Potentially Preventable Readmissions (PPRs). Clinical Analytics offers this logic as an add-on module; the output can be viewed in the Potentially Preventable Readmissions Report section in Clinical Analytics Scorecards.
See our Webinars page for a video recording explaining PPCs (Potentially Preventable Complications) and PPRs or download the presentation slides.
3M PPR logic
PPRs are chain-based and, therefore, less sensitive to readmission outliers than other readmission rate calculations. By design, PPRs include only readmissions based on conditions that could have been prevented. This analytics can reveal issues with discharge planning, post-discharge follow-up, or coordination between inpatient and outpatient teams. We can use this tool to track measures that drive outcomes-based payment and patient safety initiatives, as well as tracking the costs associated with readmission chains.
Readmission chains
This section is built on the concept of the Readmission Chain, a sequence of one or more visits related to the same initial admission.
Clinically related admissions
"Clinically related" admissions include:
- Medical readmissions for:
- A continuation or recurrence of the reason for initial admission, or for a closely related condition
- An acute medical complication related to care during the initial admission, or an acute decompensation of a chronic problem that was not the reason for the initial admission
- Surgical readmissions to address:
- A continuation or recurrence of the problem causing the initial admission
- A complication resulting from care during the initial admission
Exclusions
The following conditions are excluded from PPR calculations:
- Patients with expected readmissions
- Admissions with unique follow-up requirements
- Discharge disposition of "transferred to another acute care facility”
- Discharge disposition of “left against medical advice”
Use the PPR Section
The Potentially Preventable Readmissions (PPR) Section is specifically designed to analyze PPRs and is available only to clients licensing 3M PPR Software through Syntellis Axiom Software. Contact Support for more information about adding this capability to your server.
Note that this section is not Profiles-based, so you cannot select one of your internal profiles to analyze for this section. There is also not a Benchmark Profile selection needed for this section.
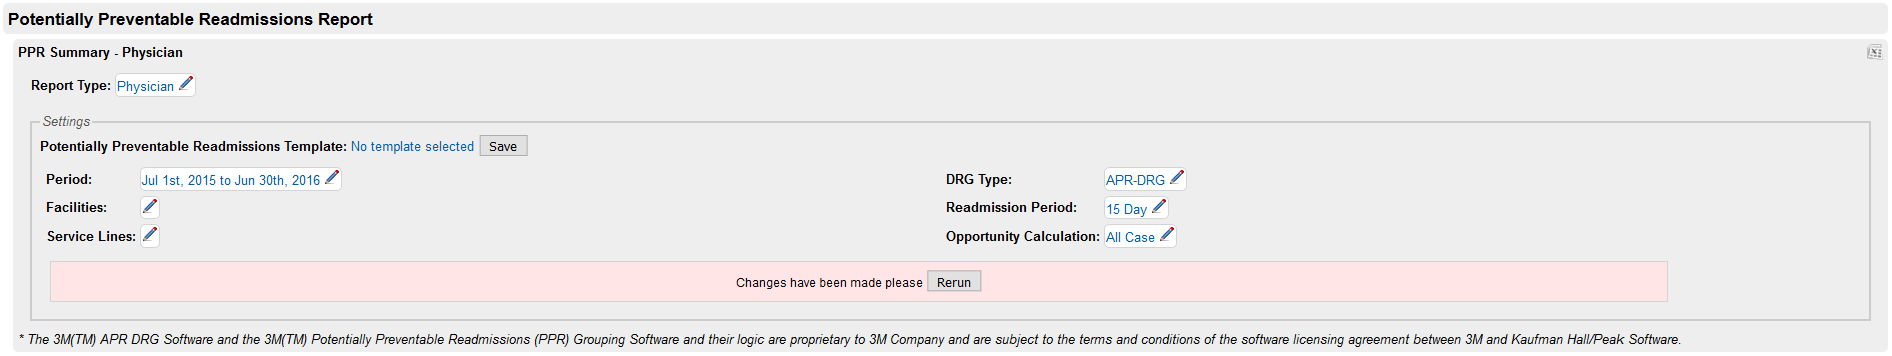
Report type
The first step of your PPR analysis is to select your initial report focus. You can set your Report Type at the top of the Potentially Preventable Readmissions section. Click the pencil icon next to the parameter to view the dropdown. These views are drillable and you can change this selection at any time.

| Report type | Intent | Group-by columns |
|---|---|---|
| Physician | This view groups readmission chains by the Attending Physician of the initial encounter; each row is an aggregation of all encounters for a particular physician. | Physician ID, Physician, Physician Specialty |
| Specialty | This view groups readmission chains by the specialty of the Attending Physician on the initial encounter; each row is an aggregation of all encounters for a particular physician specialty. | Specialty ID, Specialty |
| Physician Group | This view groups readmission chains by the Physician Group of the Attending Physician on the initial encounter; each row is an aggregation of all encounters for a particular physician group. | Physician Group ID, Physician Group |
| Service Line | This view groups readmission chains by the service line of the initial encounter; each row is an aggregation of all encounters for a particular service line. | Service Line ID, Service Line |
| APR-DRG | This view groups readmission chains by the APR-DRG of the initial encounter; each row is an aggregation of all encounters for a particular APR-DRG. | APR-DRG ID, APR-DRG |
| Client MS-DRG | This view groups readmission chains by the Client MS-DRG of the initial encounter; each row is an aggregation of all encounters for a particular MS-DRG. | Client MS-DRG ID, Client MS-DRG |
| MS-DRG | This view groups readmission chains by the MS-DRG of the initial encounter; each row is an aggregation of all encounters for a particular MS-DRG. | MS-DRG ID, MS-DRG |
Settings
| Parameter | Description |
|---|---|
| Period | Use the dropdowns to select the beginning and end dates for your time period of interest. |
| Facilities | If you would like to filter by facility, select one or more facilities to be included; not selecting any facilities returns data for all facilities. |
| Service Lines | If you would like to filter encounters by the service line of the initial encounter, click the pencil, then check the box(es) of your service line(s) of interest. |
| DRG Type | Choose between APR-DRG and MS-DRG for benchmark calculations. See Grouping types for more information. |
| Opportunity Calculation | Select if you would like All Case or Risk Adjusted opportunity calculations. See below for more information. |
Opportunity calculation
You have the option to select if you would like your opportunity calculated based on All Case or Risk Adjusted.
- All Case calculations provide the opportunity values as if the readmission never happened:
- Charges of Readmissions is equal to the total charges of all readmission encounters.
- Costs of Readmissions column is equal to the total costs of all readmission encounters.
- LOS of Readmissions is equal to the total length of stay of all readmission encounters.
- Critical Care Days of Readmissions is equal to the total number of critical care days over all readmission encounters.
- Risk Adjusted calculations provide adjusted opportunity values based on the case mix:
- Charges of Readmissions is equal to the expected difference in charges.
- Costs of Readmissions column is equal to the expected difference in costs.
- LOS of Readmissions is equal to the expected difference in length of stay.
- Critical Care Days of Readmissions is equal to the expected difference in critical care days.
Report columns
In addition to the group-by columns previously listed, your report includes the following columns:
| Column name | Description |
|---|---|
| Observed Chains | The number of readmission sequences in the group. |
| Expected Chains | The expected number of readmission sequences for the group. |
| Variance | The difference between the Observed and Expected Chains; positive (marked red) values indicate more observed chains that expected. |
| Index | Observed Chains divided by Expected Chains; values greater than one indicate more observed chains than expected. |
| Observed Readmissions | The number of readmissions observed for that group; note that one readmission chain can have more than one readmission visit included. |
| Charges of Readmissions | The charge opportunity available if the readmissions were prevented. |
| Costs of Readmissions | The cost opportunity available if the readmissions were prevented. |
| LOS of Readmissions | The length of stay opportunity available if the readmissions were prevented. |
| Critical Care Days of Readmissions | The critical care days opportunity available if the readmissions were prevented. |
